Almost every gate review includes a market-sizing slide, and almost every one of them includes a single confident number — "4B TAM" — with no visible path for how they got there, and no honest accounting of what's actually known versus assumed.
Which when faced with questions about the market sizing, can feel like you’ve compiled uninformed research, or incomplete at best. But the market sizing itself isn’t the issue.
By the time leaders review the opportunity, the underlying research has been compressed into a single slide, making it difficult to understand the assumptions, challenge the reasoning, or build on the work later.
So how do you produce reliable, defensible top-down market sizing? Done properly, top down market sizing answers: how big could this actually be?
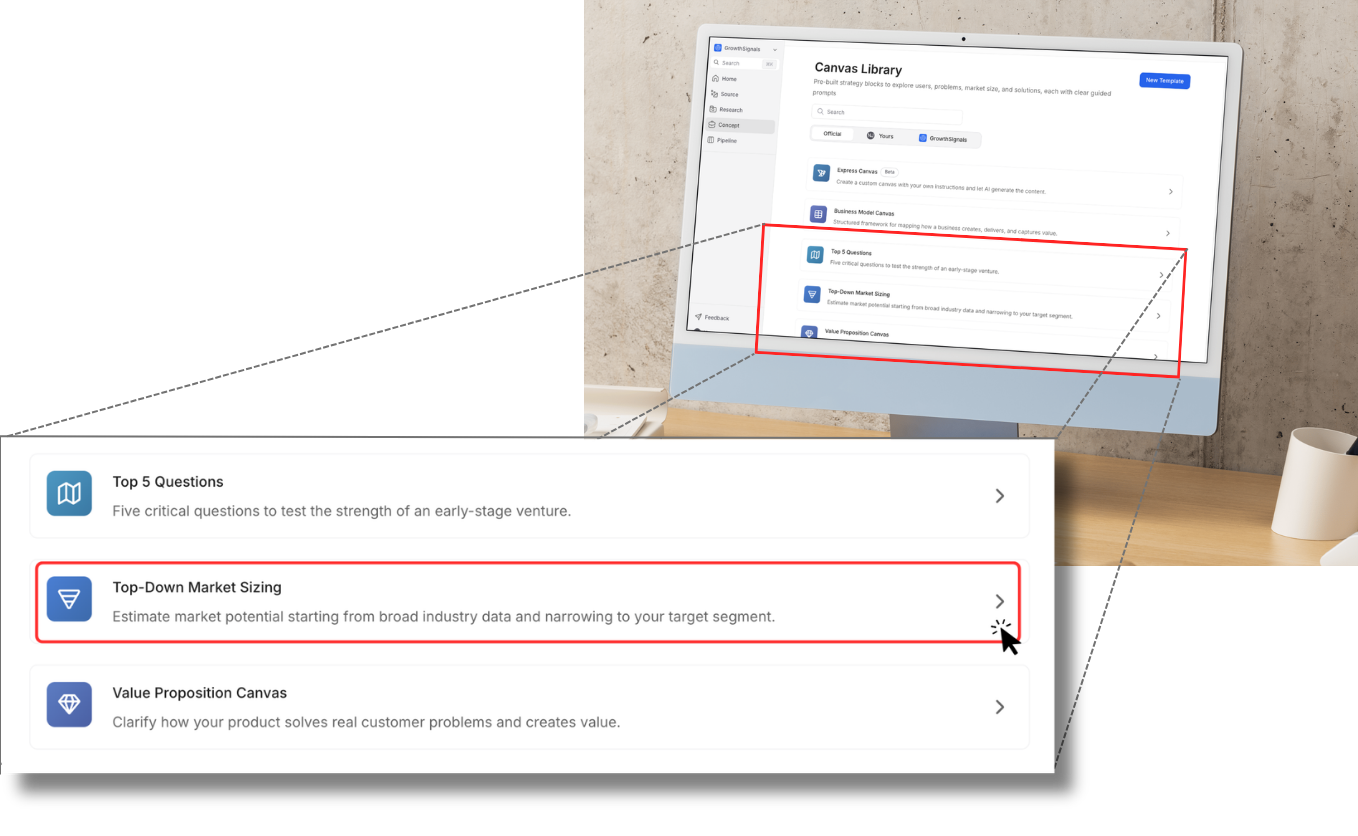
This is exactly what Growth Signals’ pre-built Market Sizing Canvas is designed to do. Provide a description of the opportunity and run the canvas where it automatically uses relevant internal and external sources to perform the TAM, SAM, SOM research and analysis outlined below. All this while still keeping the evidence and assumptions connected to the results. Here's how we would break it down within the Market Sizing Canvas:
Start with the total addressable market (TAM)
Begin as wide as the idea can honestly reach: the total spend or unit volume that exists today for the underlying need your idea addresses, industry-wide, before any assumptions about your specific product or go-to-market. This number is meant to be big and a little uncomfortable.
At this stage, the goal isn't to arrive at one "correct" number. It's to capture the sources, assumptions, and reasoning that produced it. Those become just as valuable as the estimate itself when the opportunity reaches a gate review.
Narrow to the serviceable addressable market (SAM)
Apply the constraints that are actually true about who you can serve: geography, customer segment, regulatory reach, the channels you actually have access to. This is where a lot of market-sizing slides get lazy — SAM should be visibly smaller than TAM, and the gap between them should be explainable, not rushed through.
Every narrowing decision should answer a simple question: Why are we excluding the rest? Capturing that reasoning makes future reviews dramatically easier because the assumptions remain attached to the decision instead of disappearing into someone's notes.
Narrow again to the serviceable obtainable market (SOM)
This is the number that should actually show up in a gate review: given realistic market share assumptions, competitive response, and go-to-market capacity over a defined time horizon, what could you plausibly capture? SOM is where "big market" turns into "big enough opportunity, for us, in a timeframe that matters."
SOM is also where leadership conversations become far more productive. Instead of debating whether the final number "feels right," teams can discuss the assumptions that produced it—and adjust them transparently as new evidence emerges.
The layer most gate reviews are missing: showing your work
Traditionally, teams have had to assemble each layer of this analysis manually. The Market Sizing Canvas runs these steps as one connected workflow, bringing together the available research, applying the relevant constraints, and documenting precisely how it moved from TAM to SAM to SOM.
The difference between a market-sizing slide that survives a gate review and one that gets picked apart isn't the final number itself—it's whether every assumption can be traced back to the evidence that informed it.
That's one of the biggest shifts Growth Signals' AI-native stage-gate platform introduces. Instead of reviewing a polished output in isolation, leaders can see the thinking behind it: where the data came from, why assumptions were made, and how the estimate evolved over time.
When you run the Market Sizing Canvas, it produces TAM → SAM → SOM as connected layers and preserves the evidence behind each narrowing step, which creates a much stronger foundation for discussion than a single polished number ever could.
Why this matters more than getting the number "right"
No early-stage top-down estimate is going to be precisely right, and treating it like it should be is exactly the false-precision problem that makes gate reviews harder to trust. The goal isn't a perfect number, it's a number that's honest about its own assumptions, structured enough that the next person doesn't have to rebuild it from scratch to figure out how you got there, and connected to the decision it's actually informing.
It's creating evidence that survives beyond a single gate review.
A good market-sizing exercise shouldn't end as another forgotten slide deck. It should become part of the organization's greater understanding of the opportunity—ready to be challenged, refined, and reused as new information becomes available through the stage gate process.
That's ultimately what an AI-native stage-gate platform enables: not better guesses, but better organizational memory and traceability. Market Sizing is only one of the pre-built canvases available in Growth Signals. Teams can also run canvases for other repeatable research and decision-making workflows or even create a completely custom Canvas around the processes their organization already uses.
Want to build a market-sizing canvas like this for your next gate review? Book a demo and we'll help you try the canvas against a real opportunity you're evaluating.